AI - HỖ TRỢ TÁC NGHIỆP

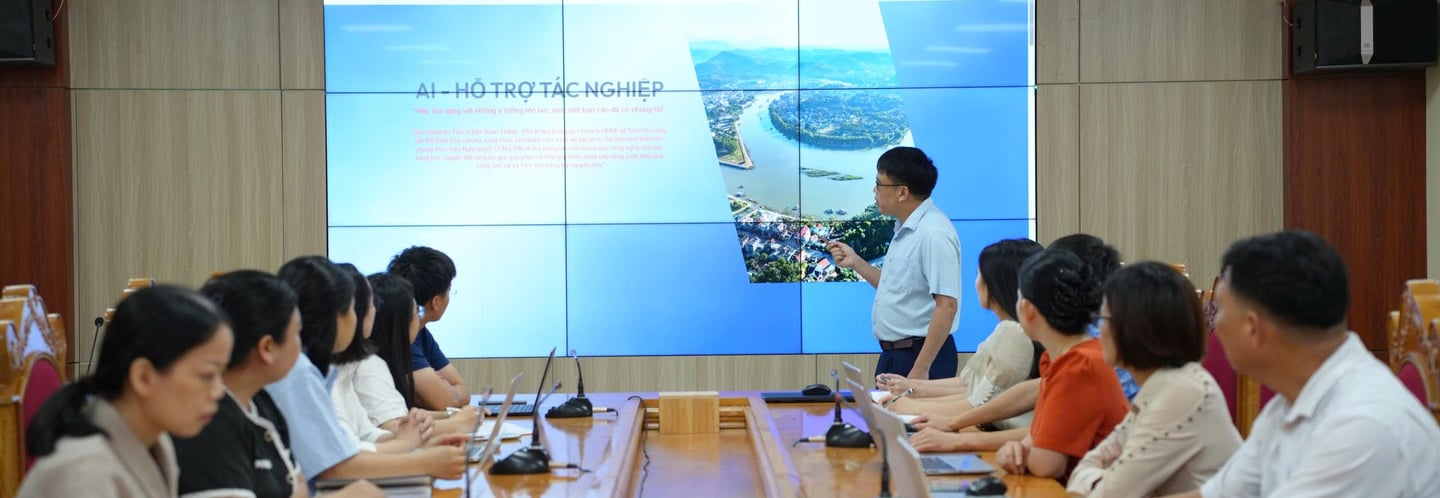
"Hãy tỏa sáng với những ý tưởng lớn lao, việc viết báo cáo đã có chúng tôi"

“Sản phẩm do Tiến sĩ Đào Xuân Thắng - Phó Bí thư Đảng ủy, Chủ tịch HĐND xã Tiên Yên cùng tập thể lãnh đạo, cán bộ, công chức xã nghiên cứu, thiết kế, lập trình, thể hiện tinh thần tiên phong thực hiện Nghị quyết 57-NQ/TW về đột phá phát triển khoa học, công nghệ, đổi mới sáng tạo, chuyển đổi số quốc gia; góp phần số hóa quy trình, nâng cao năng suất, hiệu quả công việc tại xã Tiên Yên trong Kỷ nguyên mới.”

Đánh giá: 5 sao

★★★★★

Giới thiệu về chúng tôi

Chúng tôi là tổ chức hỗ trợ huấn luyện nhân viên viết báo cáo và tổng hợp số liệu hiệu quả.

Hỗ trợ tuyệt vời cho nhân viên.
"

Dịch vụ hỗ trợ

Chúng tôi cung cấp dịch vụ xây dựng trợ lý AI cho mỗi cơ quan, đơn vị; tập huấn sử dụng biến nhân viên yếu kém của bạn trở thành những ngôi sao mới

Viết báo cáo

Hỗ trợ nhân viên viết báo cáo, tổng hợp số liệu và giải đáp thắc mắc công tác hiệu quả.

A whiteboard with blue marker drawings and text. The left side features a series of boxes and arrows, along with handwritten labels and lines suggesting a flowchart or diagram. Text includes terms like 'docs', 'identify', and 'trainer'. The right shows an arrow pointing to a boxed section with more text entries, one including a name.
Hỏi đáp

Cung cấp nền tảng hỏi đáp cho nhân viên, giúp giải quyết thắc mắc nhanh chóng và hiệu quả.

Nhân viên cần đăng nhập để sử dụng các tính năng hỗ trợ viết báo cáo và hỏi đáp.

Đăng nhập
A financial report is laid out with an intricate chart showing data trends over multiple years. Surrounding text appears to be in a newspaper format, with graphs and tables prominently displayed. The focus is on a detailed line graph illustrating fluctuations.
A computer screen displaying analytics dashboards with various charts, including a line graph on the left and a cohort analysis table on the right. The table is populated with different shades of blue, indicating varying levels of user activity over several weeks. Text labels and numbers detail user retention statistics.

Liên Hệ

Vui lòng điền thông tin để được hỗ trợ viết báo cáo và hỏi đáp công tác hiệu quả.

Tôi rất hài lòng với trang web này. Nó giúp tôi dễ dàng viết báo cáo và tìm kiếm thông tin cần thiết cho công việc.

Nguyễn Văn Dương

A group of people is gathered for a sensitivity training session, posing together for a photo. Many are wearing uniform-like attire in brown and yellow, and most are wearing face masks. They appear to be in a conference room with a banner behind them and portraits hanging on the wall.

★★★★★